
The Overlay Viewer Application
All viewers can display overlays. The Overlay Viewer is particularly optimized for this task. This is shown below.
Creating Overlays
The overlay viewer tool is a viewer that shows both anatomical/background images and functional/mask overlay images in both an Orthogonal (three orthogonal slice viewer shown above) and a Mosaic (multiple parallel slices – see below) viewer, which are synchronized to have the same color mapping scheme.
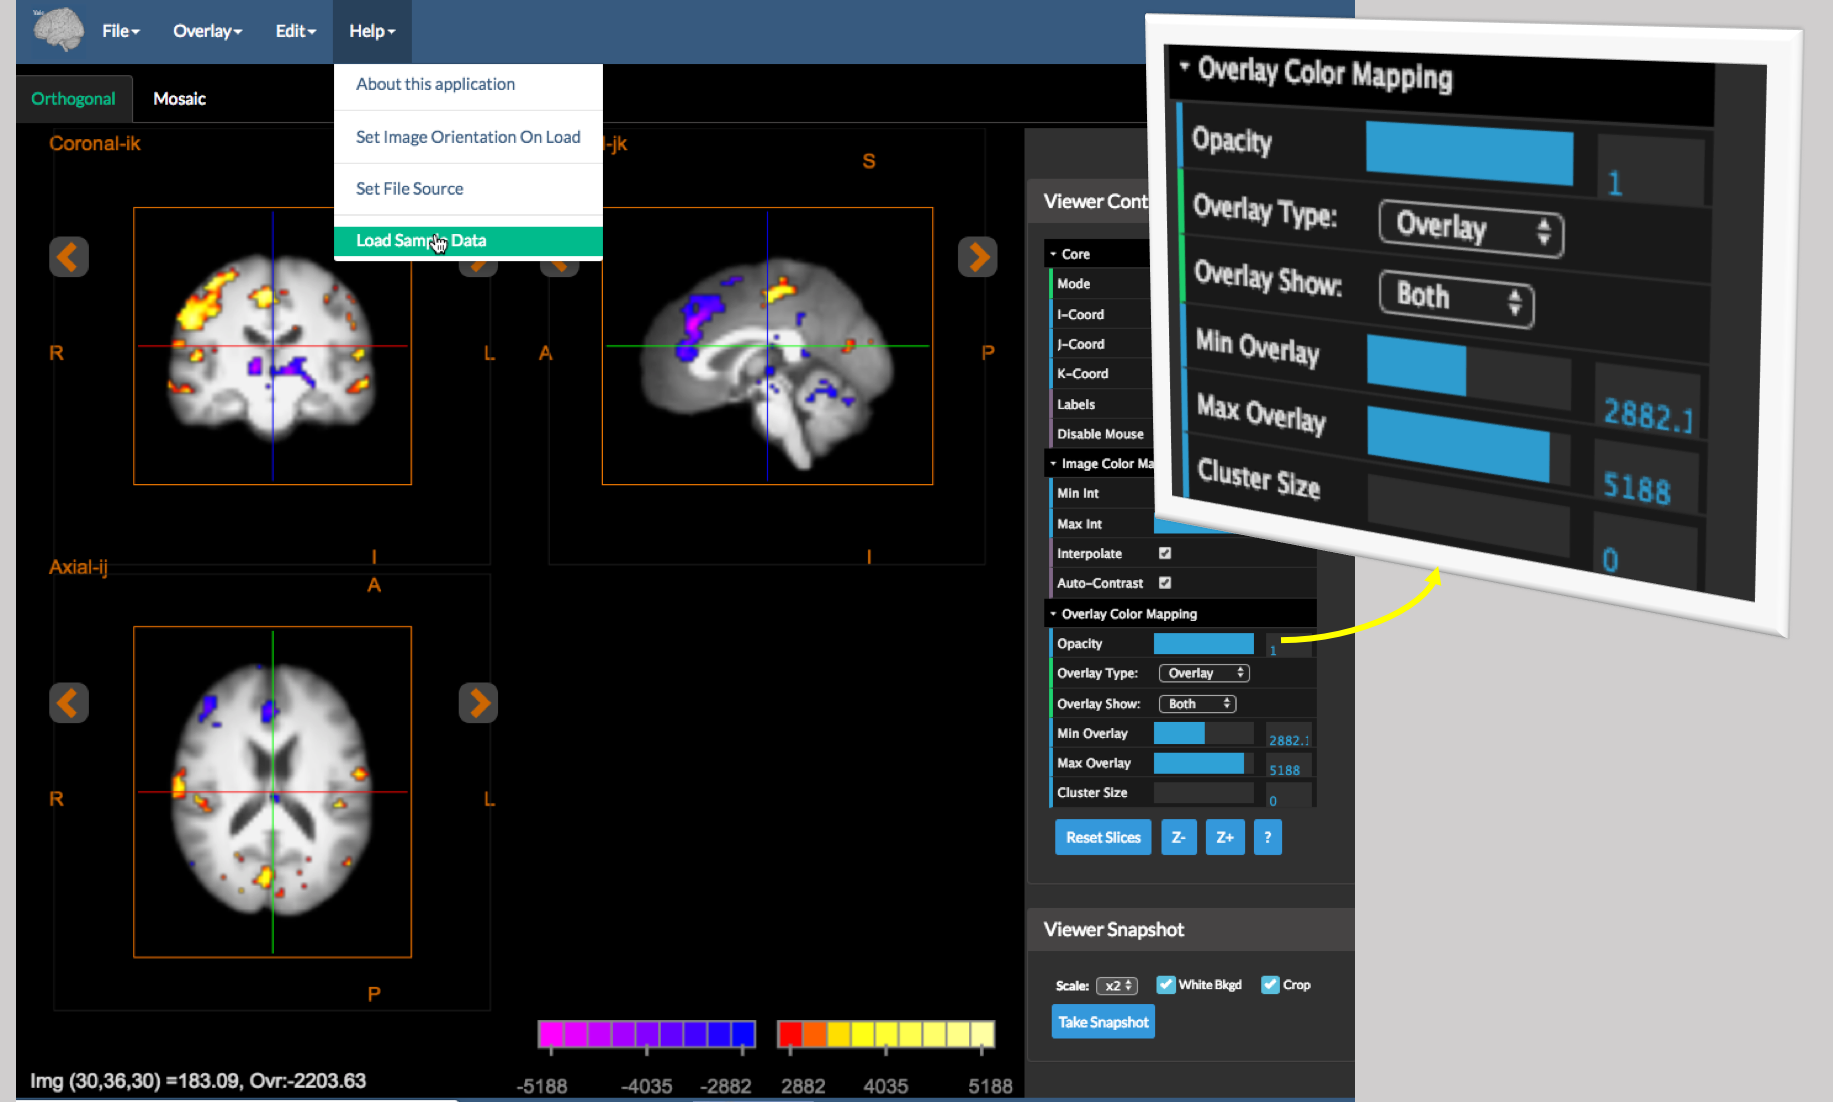
To try this out, open the application from the main BioImage Suite web page (under Applications| Overlay Viewer) and then under Help, select Load Sample Data. This will load a sample anatomical/functional image pair. (You may load your own images using Image|Load Image and Overlay|Load Overlay. As discussed above, once an overlay image is loaded, the Viewer Controls have an additional set of controls labeled Overlay Color Mapping (shown on the right). The controls here perform the following tasks:
Opacity- the relative opacity of the overlay image, with range 0 (completely transparent) to 1 (fully opaque). Use this to partially show the anatomy under the functional map if desired.Overlay Type– the overlay can be displayed using a number of different color map schemes. These are:Objectmap– this is used for displaying sementation objectmaps/masks. The overlay is rendered using a rainbow-like lookup table.OverlayandOverlay2– these are slightly different variants of colormaps used to display functional images. The mapping (explicitly shown in the colorscale in the viewer – bottom right – is performed as follows):Overlay Show– toggle to display either onlyPositiveor onlyNegativevalues, orBothto show both positive and negative values in the overlay.Min Overlay– parts of the overlay whose intensity fall below this (in an absolute sense) are displayed in a completely transparent color (not shown effectively).Max Overlay– overlay intensity values above this value are saturated to the full color selected.Cluster Size: if this is greater than 0 then cluster filtering is performed to eliminatesmallblobs.
Red,Green,Blue,Orange,Gray– this display the image using an anatomical style color mapping. This is useful for overlaying two anatomical images to check registration results etc. In this setting, no clustering is performed and the colorscale is hidden.Min OverlayandMax Overlayhave the same functionality as above.
Note: In the bottom corner of the viewer, the text ``Img (30,36,20) = 183.09, Ovr=-2203.83` now shows the intensity of both the anatomical image (183.09) and the overlay image (-2203.83).
The Atlas and Cluster Tools
These tools allow one to further analyze a functional overlay. They can be accessed under the Edit menu using the Atlas Tool and Cluster Tool options respectively.
The Atlas Tool
The atlas tool provides information about the location under the viewer crosshair (in the Orthogonal Viewer only). Each time a new point is navigated to the atlas tool shows information about the point under the crosshairs in real time. The figure below shows an example:
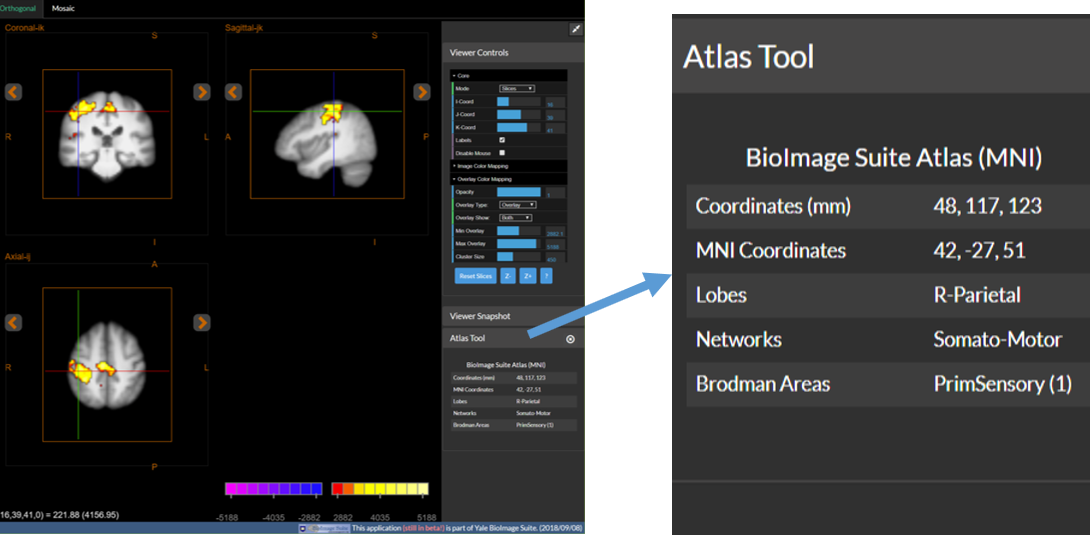
The definition of lobes and Brodmann areas derives from some of our prior work (see the MNI2TAL for references and details. The Networks are derived from the work of Power et al, Neuron 2011. The software detects if the image is in the space of one of its existing atlases (by using the image dimensions in mm – the only one currenly available is the “human brain atlas”) and automatically provides the information. If the image is not in MNI space, for example, then no information can be provided.
The Cluster Tool
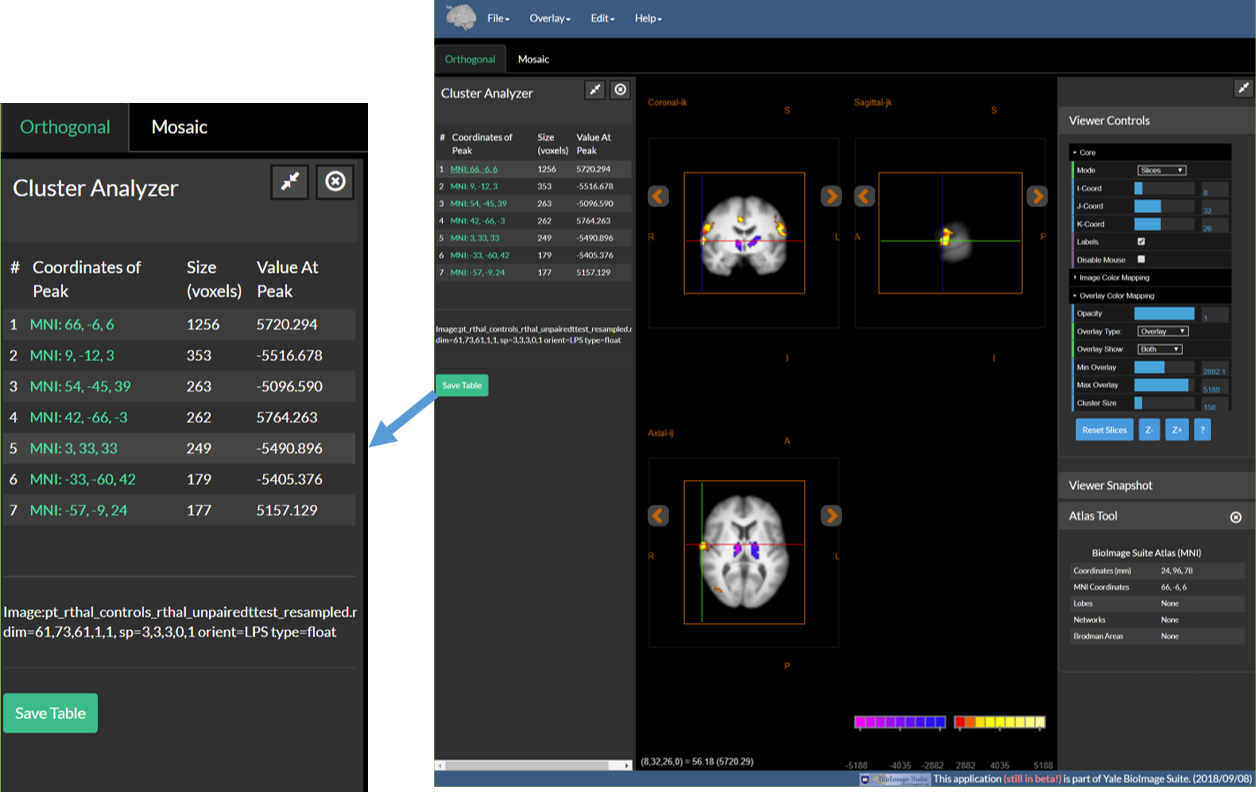
The cluster tool provides an easy way to examine the larger functional clusters in your data. Prior to using this, one must cluster the functional overlay by setting the cluster threshold in Viewer Controls/Overlay Color Mapping as described previously in this document. Once a cluster threshold is set, the cluster tool will automatically list the clusters that survive the thresholds (or the largest 25 if there are more). This is displayed in the left sidebar as shown in the figure below. Click on the coordinates (in green) of any cluster to navigate to the peak activation inside this cluster. The cluster table may be saved to a csv text file by clicking on the Save Table button that is located at the botom of the table.
Mosaic Viewer
This application can also be switched to Mosaic view by clicking the Mosaic Tab (just below the menu). Please note that the cluster and atlas tools do not work within the mosaic viewer tab, as this does not have a concept of current location (or cross hairs).
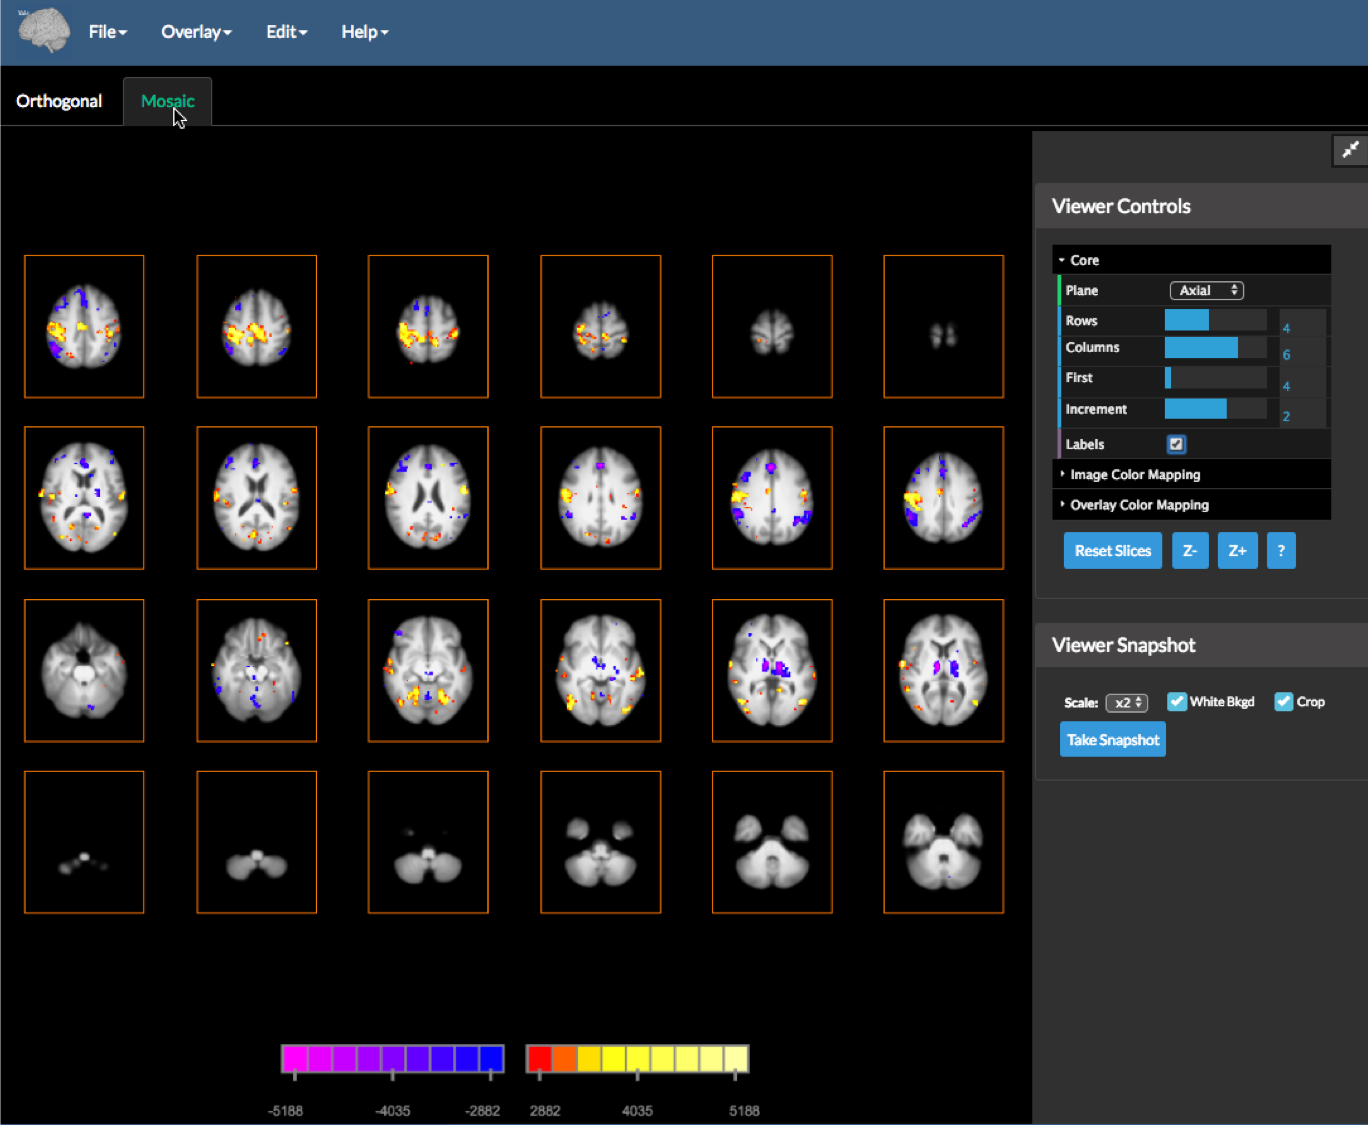
The Mosaic view shows multiple parallel slices of a particular orientation and uses the following Core Viewer Controls:
Plane– select the image plane to display.Rows– the number of rows to display.Columns– the number of columns to display.First– the first slice to display in the top left of the mosaic.Increment– the increment between displayed mosaic slices (these values may be negative).Labels– toggles mosaic slice information display on or off.
The Image Color Mapping controls are identical to the orthogonal (3-slice view) and is synchronized between the Orthogonal and Mosaic tabs.
[BioImage Suite Web Manual Table Of Contents] [BioImage Suite Web Main Page]
This page is part of BioImage Suite Web. We gratefully acknowledge support from the NIH Brain Initiative under grant R24 MH114805 (Papademetris X. and Scheinost D. PIs, Dept. of Radiology and Biomedical Imaging, Yale School of Medicine.)