
Image Editor
Introduction
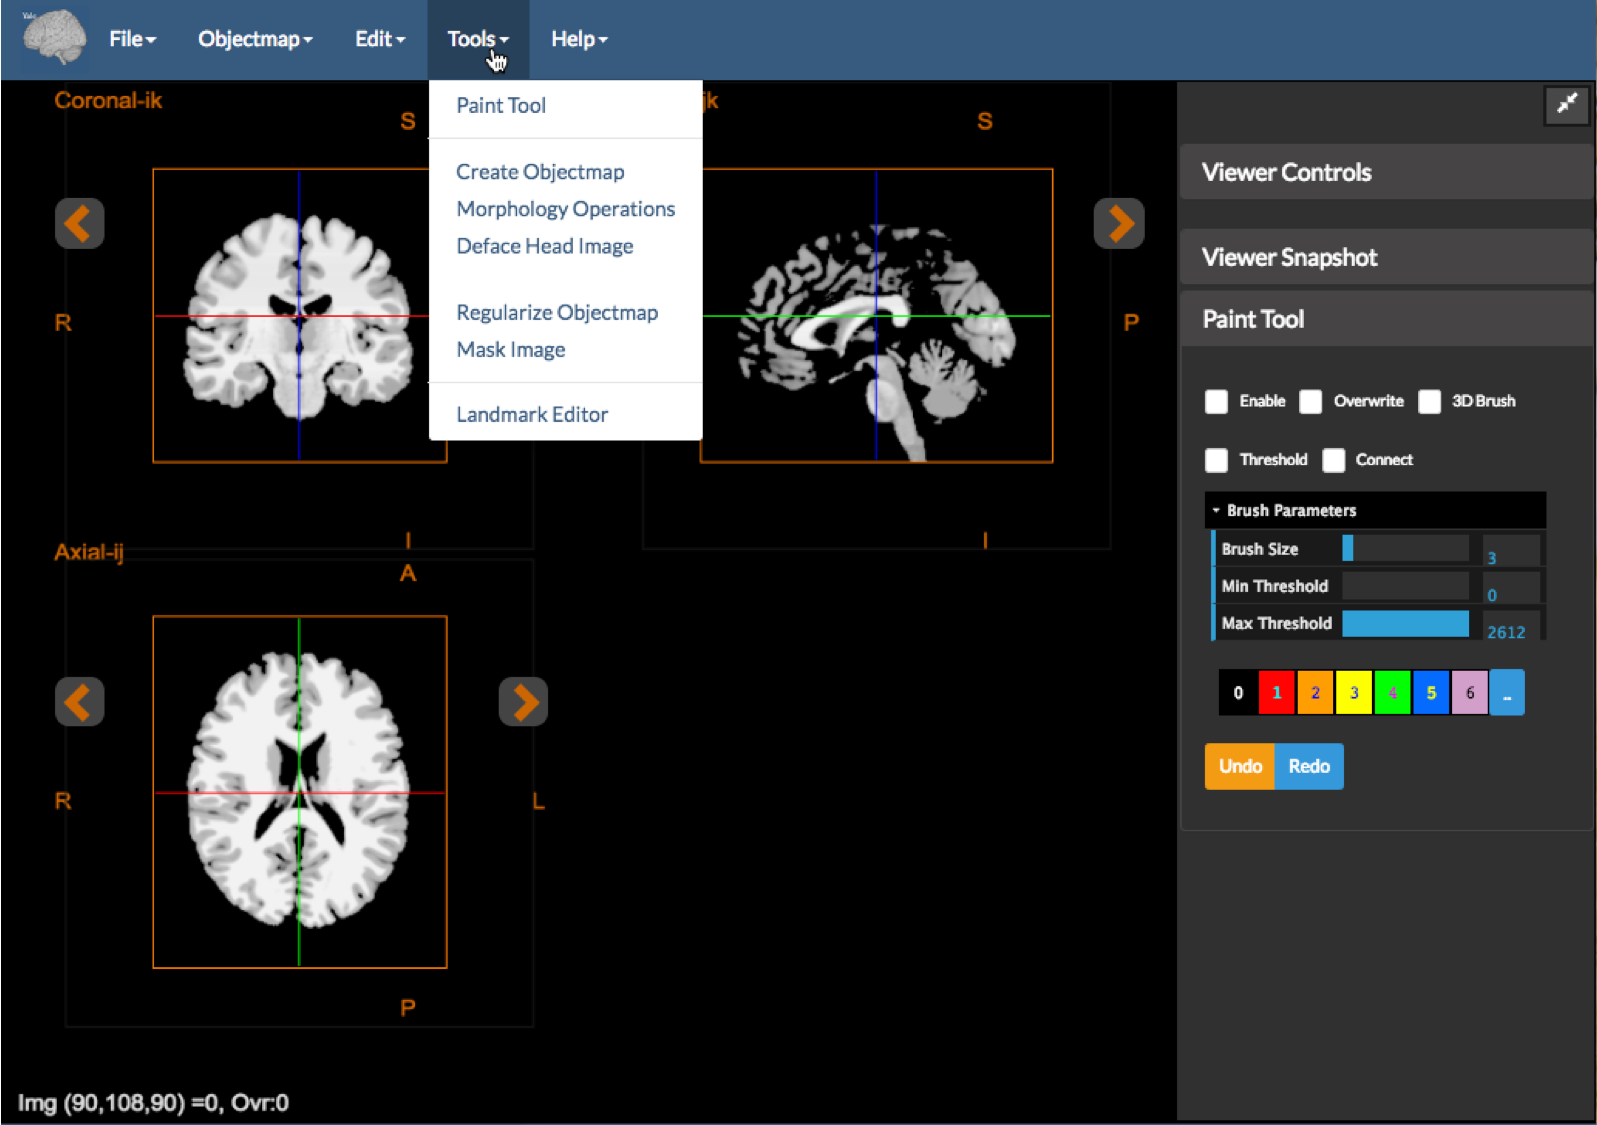
Figure 1: The image editor with the tools dropdown expanded and the Paint Tool displayed.
The Image Editor tool shown above is used to create and visualize segmentations interactively, as well as to correct existing segmentations (e.g. skull stripping). This tool uses the core orthogonal viewer described in Displaying Images. It has the following additional features:
- Overlays are labeled as Objectmaps, i.e. the value in this overlay image is explicitly a tag for a region.
- The ability to edit the object maps using the
Paint Tool. - Provision of selected set of modules for modifying object maps. These include
Create Objectmap,Morphology Operations,Regularize Objectmap, andMask Image. - The integration of the volume-of-interest (VOI) analysis tool that uses the current objectmap to analyze the underlying image. VOI analysis will work with both a timeseries and a static image.
- The ability to manually identify and localize landmarks with respect to the image data using the
Landmark Editor.
Creating an Objectmap
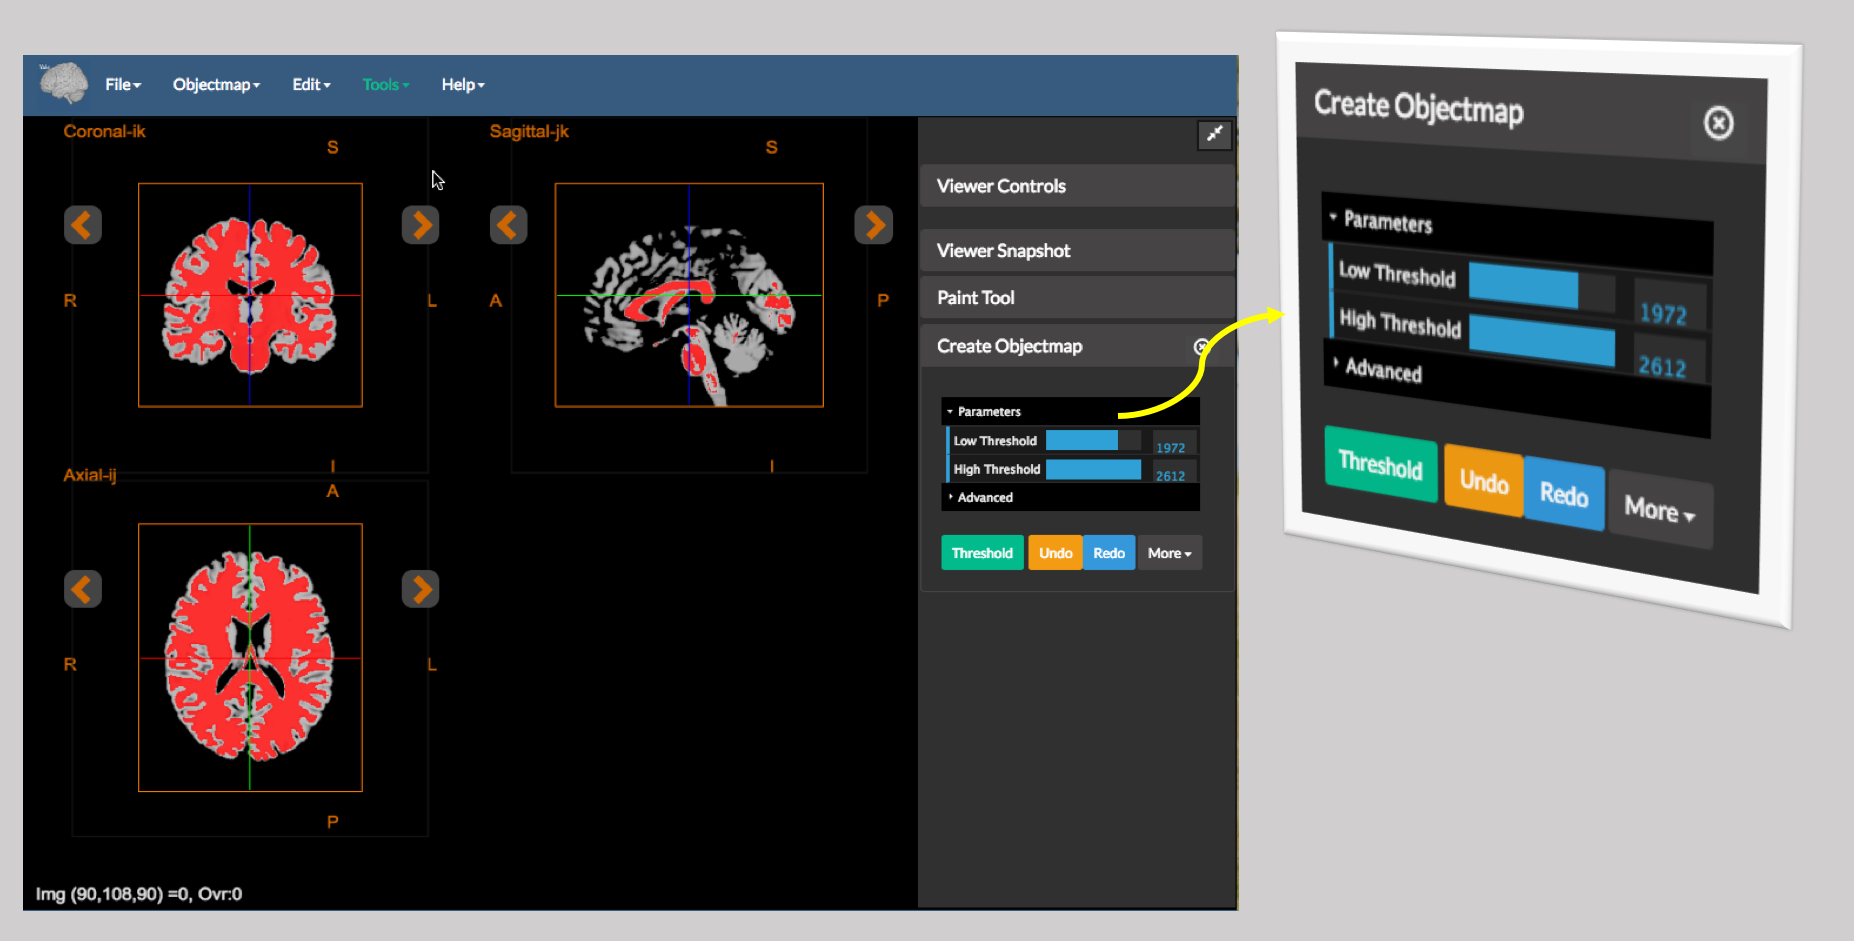 Figure 2: A sample image thresholded using the Create Objectmap tool built into the editor.
You can create an objectmap in one of three ways:
- Load it from an existing binary file. (Under
Objectmap->Load) - Create it by manually defining the regions using the
Paint Tool - Create it by thresholding the underlying image. Figure 2 shows the output of
Create Objectmap. Note that this tool essentially performs a binary threshold.
Detailed Objectmap Operations
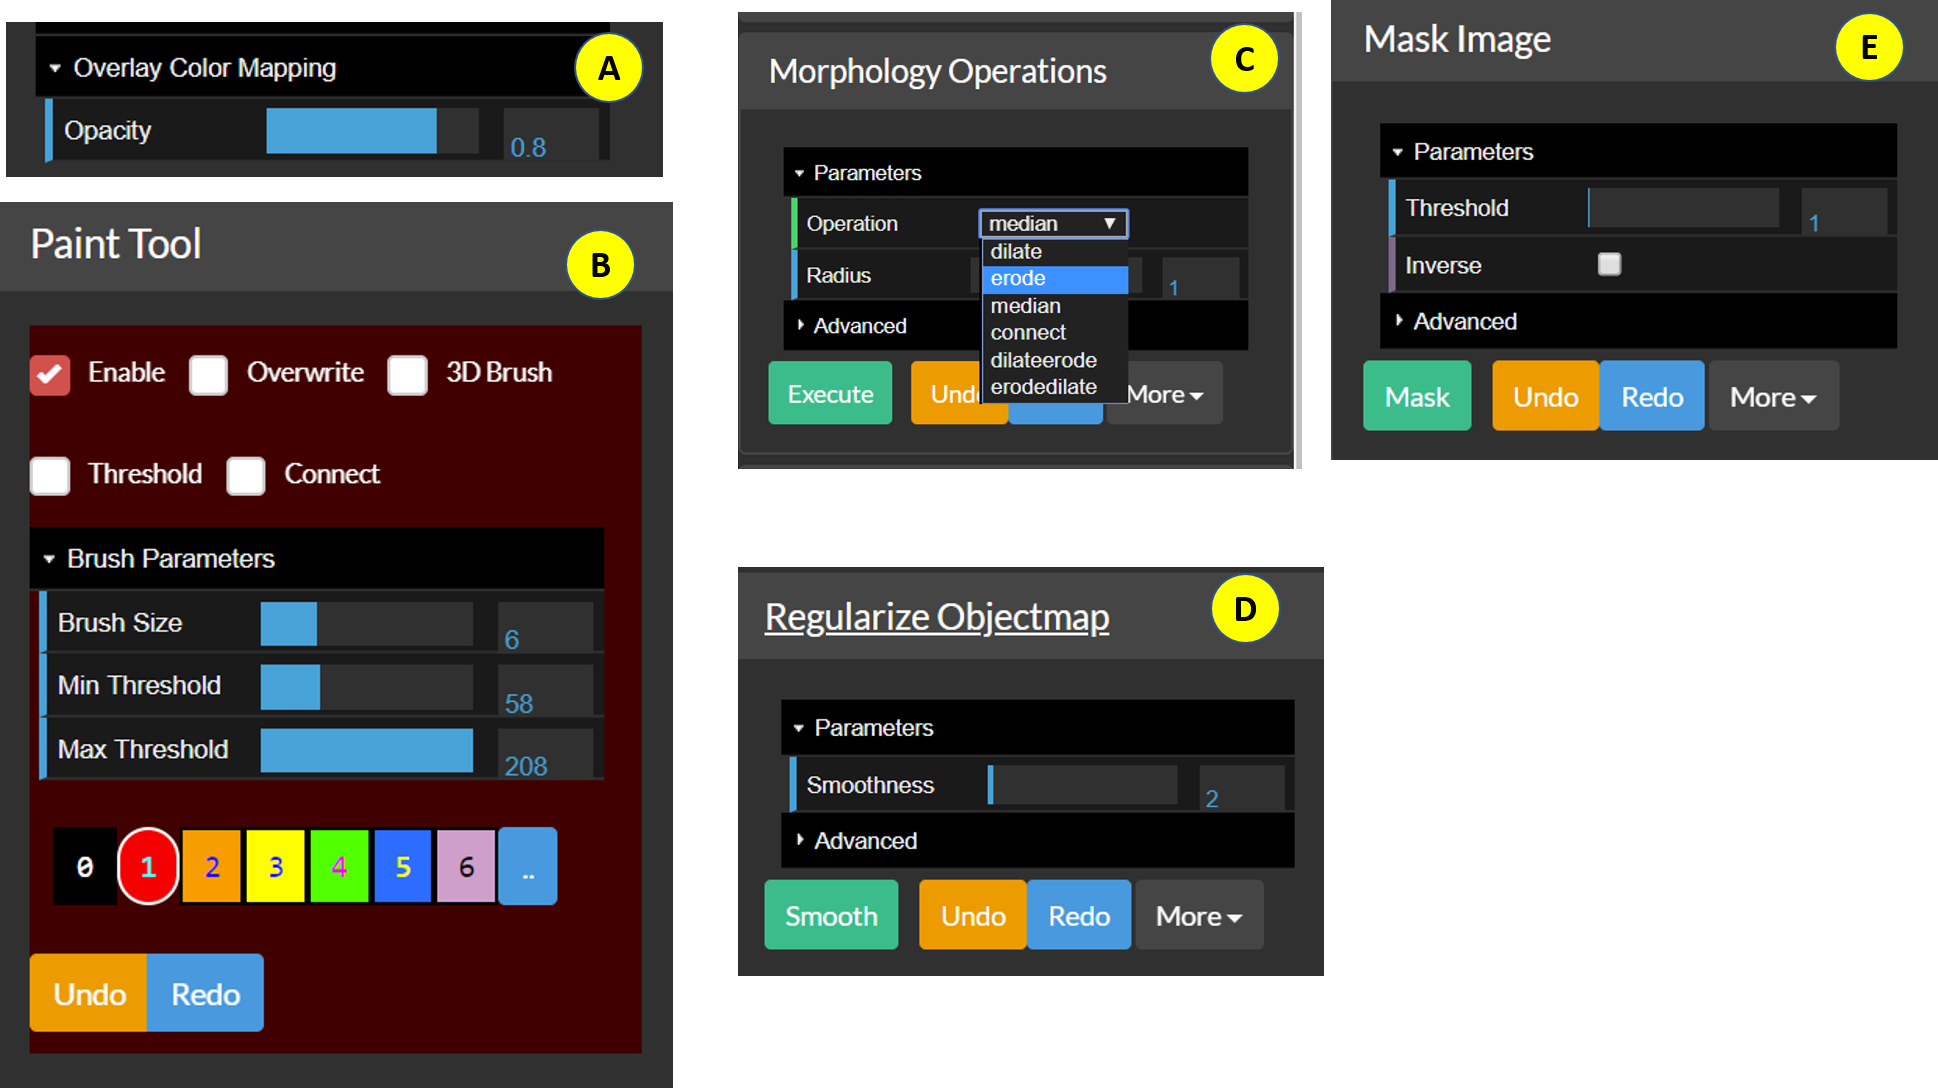 Figure 3: The individual components of the Image Editor.
Once an objectmap is in memory it can displayed and manipulated using tools provided in the Image Editor Tools menu.
- A: Overlay color mapping — The editor explicitly assumes that the overlay is an objectmap, hence the only display/color mapping option available is the
Opacity. -
B: The
Paint Toolis the core of BioImage Suite Web’s interactive segmentation tools. Essentially, this is a smart paintbrush tool where the user selects a color and paints over the image to create/edit an objectmap. The following is a brief description of the functionality included in this:Enable— If this isOnthen the paint tool receives mouse input and uses it to paint on the viewer’s objectmap.Overwrite— If this isOnthen regions already defined may be erased by painting over them. Otherwise, you can only paint where the objectmap iszeroorbackground.3D Brush— If this isOn, painting is done with a brush that extends to multiple slices, otherwise the image is colored only on the current slice. This will work for any slice in the viewer.Threshold— IfOnthen the image is colored in only if the background intensity is between theMin ThresholdandMax Threshold.Connect— IfOnand ifThresholdis on then the paintbrush only fills in voxels between the thresholds that are ‘connected’ to the central voxel.Brush Size— Sets the brush size in voxels.[0][1][2][3][4][5][6][..]— Selects the color to use while painting. The colorblack, selected by pressing the[0]button, is the eraser provided thatOverwriteisOn.[..]will display a menu containing more colors.UndoandRedobuttons — Perform undo and redo operations.
C. The Morphology Operations tool — This performs morphological image processing operations such as erode, dilate, median, and connect (seed connectivity from current cross-hairs) etc. on 0/1 objectmaps. If the objectmap contains multiple colors then they will be converted to 0 or 1.
D. The Regularize Objectmap tool — Performs Markov Random Field Regularization to smooth manually painted regions. It was developed for the construction of the Yale Brodmann Atlas, which can be loaded under Obejctmap -> Load Yale Brodmann Atlas. To get a desired level of smoothness, set the smoothness value and press Smooth.
E. The Mask Image tool — This can be used to mask the underlying anatomical image with the objectmap to mask out all parts of the image outside the mask. Setting Inverse to On will mask the region inside the objectmap instead. Before masking, the objectmap must be binarized by thresholding it using the threshold set using the Threshold slider.
VOI Analysis Tools
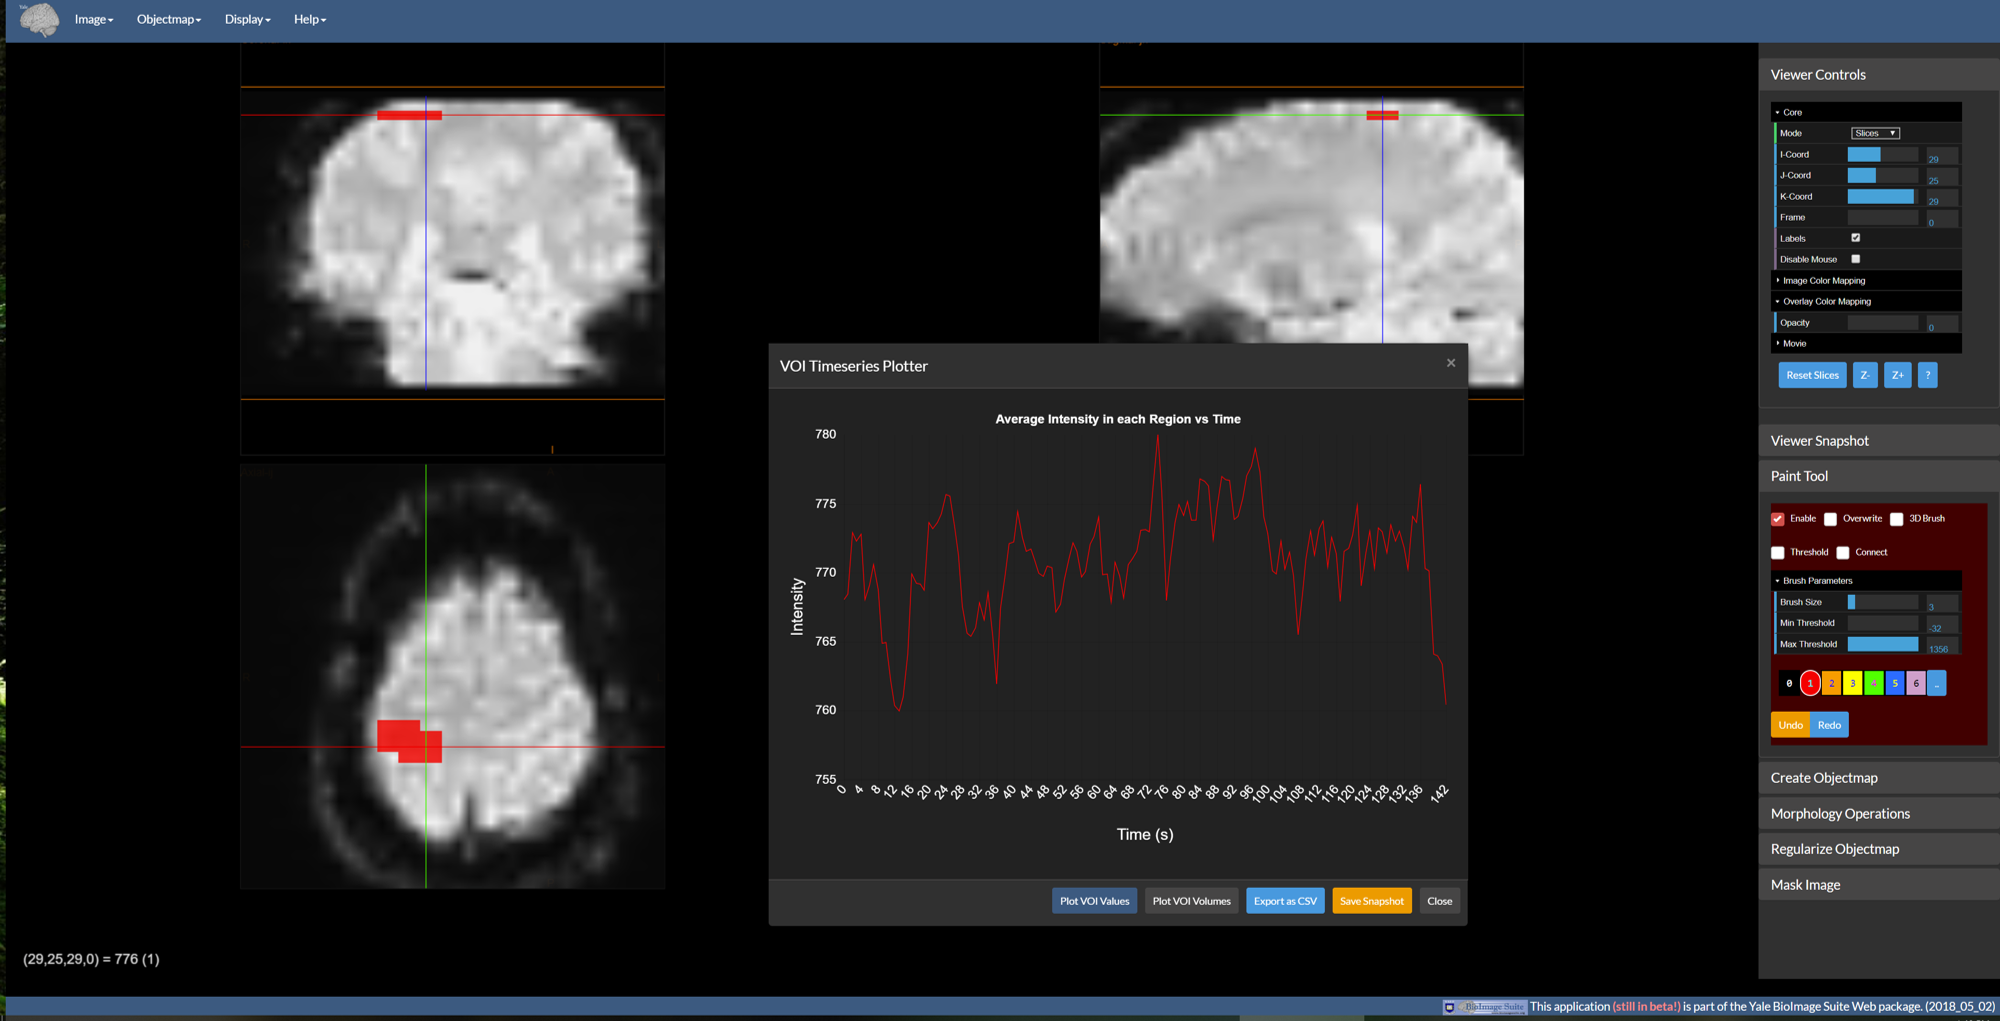 Figure 4: The VOI analysis window displayed over the viewer.
Given an image and an objectmap, we can generate plots of VOI image data. If the image is 4D, this tool will instead generate image timeseries plots as shown above. To invoke this control go to Objectmap -> VOI Analysis. By default, the graph shows the average intensity in each region over time. There are five buttons at the bottom which do the following:
Plot VOI Values— This is the default operation. If the underlying anatomical image is 4D the result is a plot like the figure above. If it is a 3D image, then a bar chart is generated instead.Plot VOI Volumes— Creates a bar chart of VOI region volumes (in mm^3).Export as CSV— Outputs the data used in the plots as a comma-separated file (CSV) for import into Excel, Matlab, etc. for more detailed plotting.Save Snaphot— Saves the current plot as a.pngimage file.Close— Closes the VOI Timeseries plotter window.
Landmark Editor Tool
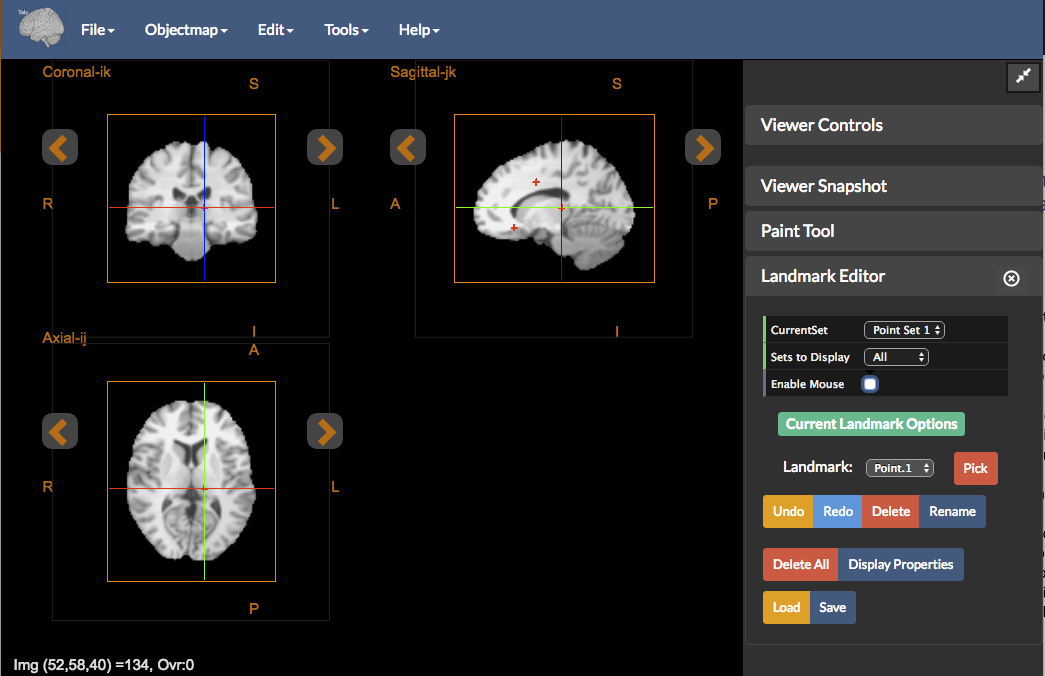 Figure 5: The Landmark Editor tool.
The Landmark Editor provides functionality for manually identifying and localizing landmarks of interest within the imaging data. To invoke this control go to Tools -> Landmark Editor. By default, if no image data is loaded in the viewer, the Landmark Editor tools will be empty. The Landmark Editor tool has the following functionality:
Current Set- The Landmark Editor allows for up to five different sets of points to be recorded, each labeledPoint Set 1,…,Point Set 5Sets to Display- Selects which Point Set to display in the viewer. Choices are: (i)Currentto display the currently selected Point Set (default), (ii)Allto display all Point Sets, and (iii)Noneto display no landmarks.Enable Mouse- Toggle to enable placement or editing of landmarks using the mouse.
The Current Landmark Options operate on the currently selected Point Set in Current Set:
Landmark- Selects the currently ‘active’ landmark from the drop down list of landmarks, if any. Selecting a landmark centers the image viewer crosshairs on the currently selected landmark.Pick/Release- ThePickbutton allows for editing landmark locations. If theEnable Mousetoggle is checked, pressing thePickbutton will allow the landmark to be moved (a circle will appear around the landmark to indicate that it can be moved). TheReleasebutton will appear to discontinue landmark location editing.Undo- Undo the last landmark operation.Redo- Redo the previous landmark operation.Delete- Deletes the currently selected landmark inLandmark.Rename- Renames the currently selected landmark inLandmark.Delete All- Delete all landmarks in the current Point SetCurrent Set.Display Properties- Select the color of the Point Set inCurrent Set.Load- Load a previously saved set of landmarks.Save- Save the set of all landmarks. This will save all landmark Point Sets and their properties.
[BioImage Suite Web Manual Table Of Contents] [BioImage Suite Web Main Page]
This page is part of BioImage Suite Web. We gratefully acknowledge support from the NIH Brain Initiative under grant R24 MH114805 (Papademetris X. and Scheinost D. PIs, Dept. of Radiology and Biomedical Imaging, Yale School of Medicine.)